This semester I took a very interesting Data Visualization class taught by Prof. Lev Manovich. The class explored multiple technics including data exploration, data mining, machine learning, etc. I liked unconventional look at data where the final results are considered to be an art rather than science, yet all results were with a high degree of precision.
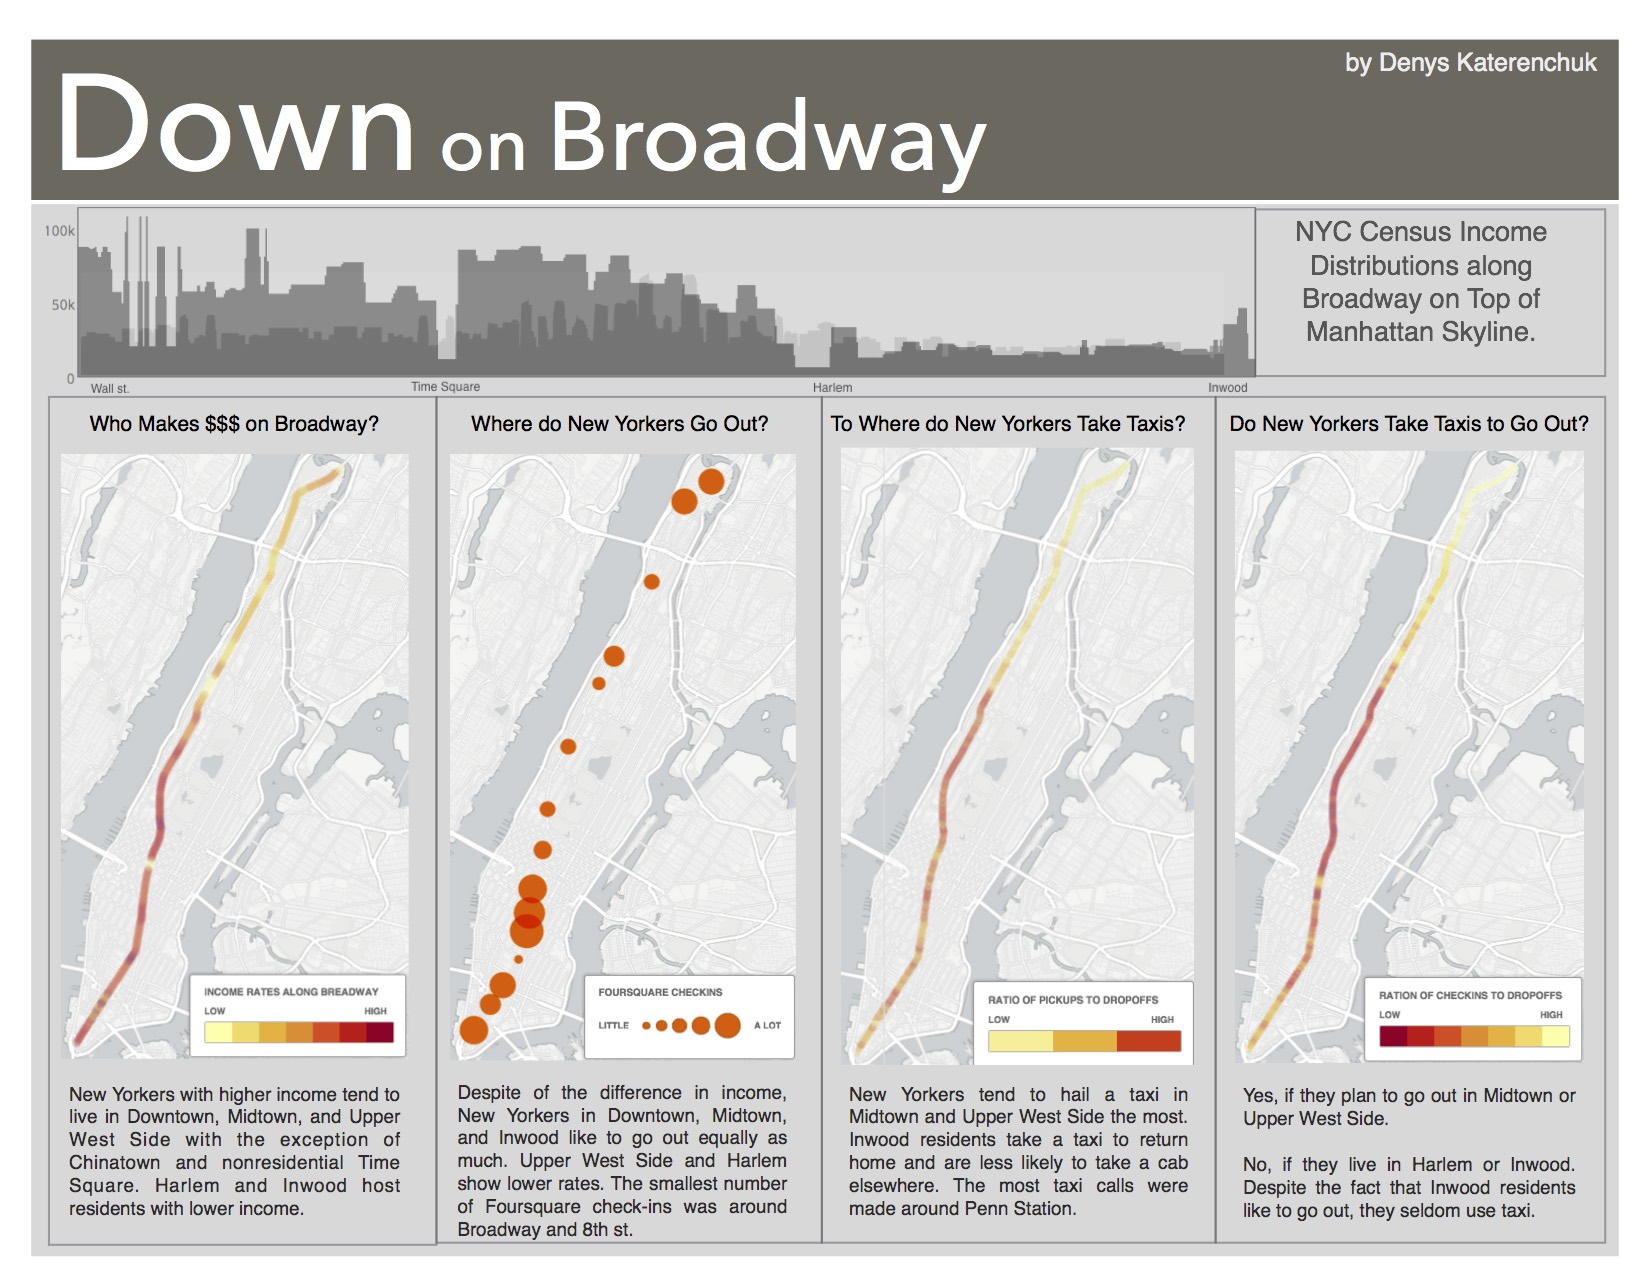
In one of the assignments, I investigated Broadway street in NYC. This is the longest street that runs through Manhattan which makes it a great source of data. The areas of investigation were income change along Broadway, taxi rides, and foursquare check-ins. The results are made into a popular science (artistic) poster.