[Note: Unfortunately, most images were lost due to changes in carto.com service.]
New York City is one of the most famous places on earth. Movies, songs, and stories celebrate the city and its culture. People from around the world bring their habits and cultures, creating eclectic and diverse neighborhoods just feet apart. All this attracts people to visit or perhaps even move to NYC. On the other hand, it’s commonly believed that New Yorkers are rude and that it’s a tough city to live in. Being a Ph.D. student, I take all these stories with a grain of salt. I decided to investigate what people in New York actually feel throughout the day by analyzing Instagram captions. Additionally, we will compare the neighborhoods of Manhattan and nearby boroughs to identify which are the most positive and negative.
Data Collection
Instagram is a popular platform for sharing photos and videos. However, it’s also an excellent source for text analysis. Users often share their feelings through Instagram captions, and due to the indirect nature of these comments, the words might carry different types of information than, say, text messages or Twitter posts. In total, we analyzed 3.04 million Instagram posts from almost 400,000 users. Since the number of Instagram posts is so large, I used a random sample—a common approach when dealing with large datasets to improve performance while preserving high precision.
Text Sentiment Analysis
Sentiment analysis of text is a well-known technique in Natural Language Processing. The concept is that certain words carry positive or negative meanings. For example, the word “good” might have a positive score of “+3” and the word “terrible” a negative score of “-5”. In this project, I used the AFINN word list. Each word in an Instagram caption is converted into its corresponding score, and we simply sum them up to determine the overall mood.
Geographic Distribution
First, let’s examine the overall picture. This analysis uses a random sample of 10,000 Instagram posts. The larger red circles represent higher degrees of positivity. From the map, we can see that positive comments are posted throughout New York with a concentration in the Midtown area and around Times Square.
[Interactive Map is Missing]
Temporal Patterns
Another interesting aspect is how people’s behavior changes throughout the day. For this experiment, I used the same data but ordered it by hour, allowing us to view posts continuously across each hour. At first, the results may seem chaotic, but upon closer examination, a pattern emerges. From the beginning, Manhattan explodes with positive posts. Interestingly, from hour 20 to hour 32, activity slows down briefly before bursting back to life.
[Animated Map is Missing]
Filtering Out Tourists
If you’ve been paying attention, you may have noticed that the most active areas are around Times Square, a famous tourist attraction. Of course tourists are happy—they’re in New York! But what about people who actually live in NYC? Therefore, the next step is to examine only posts by New Yorkers. To accomplish this, I filtered out tourists from the data. My hypothesis is based on the assumption that most tourists stay in New York for no longer than two weeks. For the remaining experiments, I used data from users who had at least two posts more than two weeks apart. This approach resulted in losing 71% of users (from 400k to 135k) but only 27% of Instagram posts (from 3 million to 2.2 million).
[Interactive Map is Missing]
Positive vs Negative Distribution
Now we can compare positive versus negative posts. The first graph shows the correlation between positive and negative scores. As we can see, there’s a strong correlation between positive and negative scores, meaning that posts with high positive scores are likely to have high negative scores as well. This isn’t surprising, since people tend to express both positive and negative emotions in their posts.
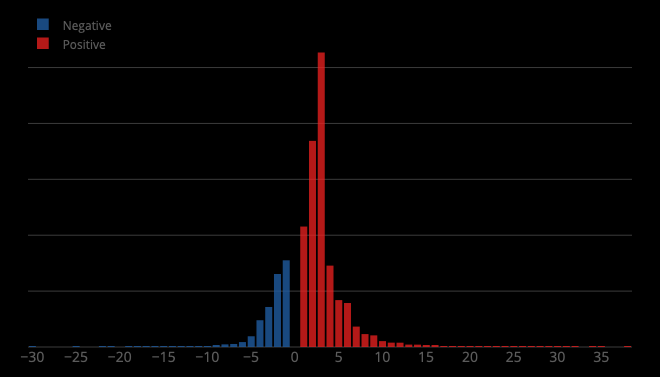
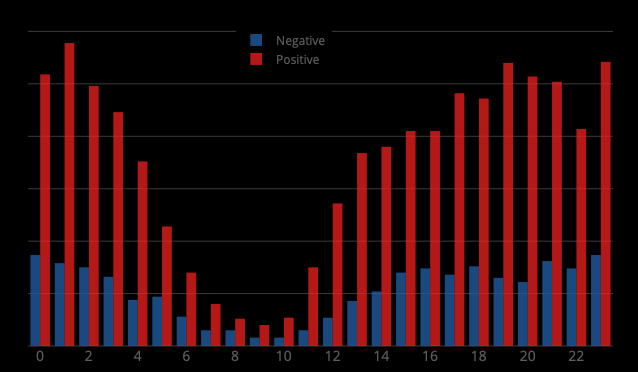
In fact, only 23% of posts produced negative sentiment. Positive posts outnumber negative ones by a significant margin throughout most of the day. However, from 7 AM to 10 AM, post sentiment scores become quite close. My hypothesis is that this occurs before the average New Yorker has their first cup of coffee.
Hourly Mood Patterns
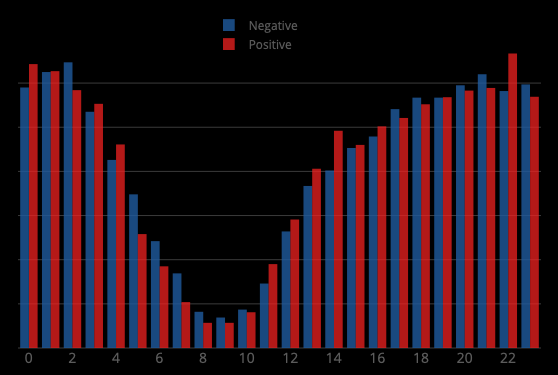
Furthermore, when we examine equal numbers of positive and negative posts and compare them by hour, we can confirm our observation. With equal numbers of negative and positive posts, the trend shows that people are most positive from 10 AM to 2 PM and between 10 PM and midnight. However, from 5 AM to 10 AM, New Yorkers can be quite cranky.
Neighborhood Analysis
Now that we understand how New Yorkers’ moods change throughout the day, let’s identify which neighborhoods are the happiest and least happy. For this experiment, I used a random sample of 100,000 Instagram posts. For each post, I mapped its upload location to a zip code. Since we already know that data centered around prime areas (such as Times Square) would lead to uneven results, I normalized the data for each zip code by calculating the average score.
After plotting the data on a map, we can see that all Manhattan neighborhoods have positive scores ranging from 0 and upward. In Manhattan, the most positive areas are around 42nd Street, Midtown East, Upper West Side, and West Harlem. The least positive Instagram posts came from the Financial District, with a score of only 0.08. Unsurprisingly, other New York boroughs also offer highly positive areas, including Brooklyn’s Flatbush Avenue, The Bronx’s Parkchester, and Riverdale. The only area with negative sentiment is the La Guardia Airport area, which scored -0.56.
[Interactive Map is Missing]
Key Takeaways
In summary, New York City is generally quite positive. This project reveals that New Yorkers are cheerful people who enjoy sharing their positive moods through Instagram. If you plan to travel to NYC, here are some tips to keep in mind:
- Tourists in New York are extremely happy.
- New Yorkers are happy 75% of the day.
- Avoid interactions with New Yorkers between 5 AM and 10 AM, when the chance of receiving a rude remark increases.
- The best times to socialize or meet new people are around 2 PM, 10 PM, or midnight.
- If you’re considering moving to NYC, the happiest residential areas of Manhattan are Midtown East, Upper West Side, and West Harlem.
Acknowledgments
I would like to thank CUNY Professor Lev Manovich and his lab for collecting and sharing the Instagram data that made this analysis possible.